Where Does All The Money Go?
Have you ever wondered what happens to the tax you hand over to HMRC?
In the Annual Tax Summary, the government makes available a clear and simple summary of how much Income Tax and National Insurance individuals paid in the last financial year and how these payments were used in its spending.
The Government used to send a printed annual summary to taxpayers that outlined how much Income Tax and National Insurance individuals paid in the last financial year and how these contributions were used in government spending. Since 2020 this information has been available online via your Government Gateway account or you can request a paper copy from HMRC.
We last looked at the summary for the 2021/22 financial year, so we thought it might be interesting to revisit the latest numbers.
According to the ONS statistics published in November 2024, in 2023/24 the government received a total of £282 billion in Income Taxes (PAYE and Self-Assessment) and £181 billion in National Insurance contributions. These taxes made up around 39% of the £1,098 billion total current receipts in 2023/24. Spending, known as total managed expenditure, in 2023/24 was £1,223 billion. The difference between these two numbers is public sector net borrowing (excluding public sector banks) – commonly known as the deficit. This was £125 billion in 2023/24.
This compares to £230 billion in Income Tax (PAYE and Self-Assessment) and £161 billion (NI contributions) in 2021/22 when the total receipts figure was £918 billion.
The diagram below shows how the Government spent the money it raised through Tax and NI in the financial year to 5 April 2024.
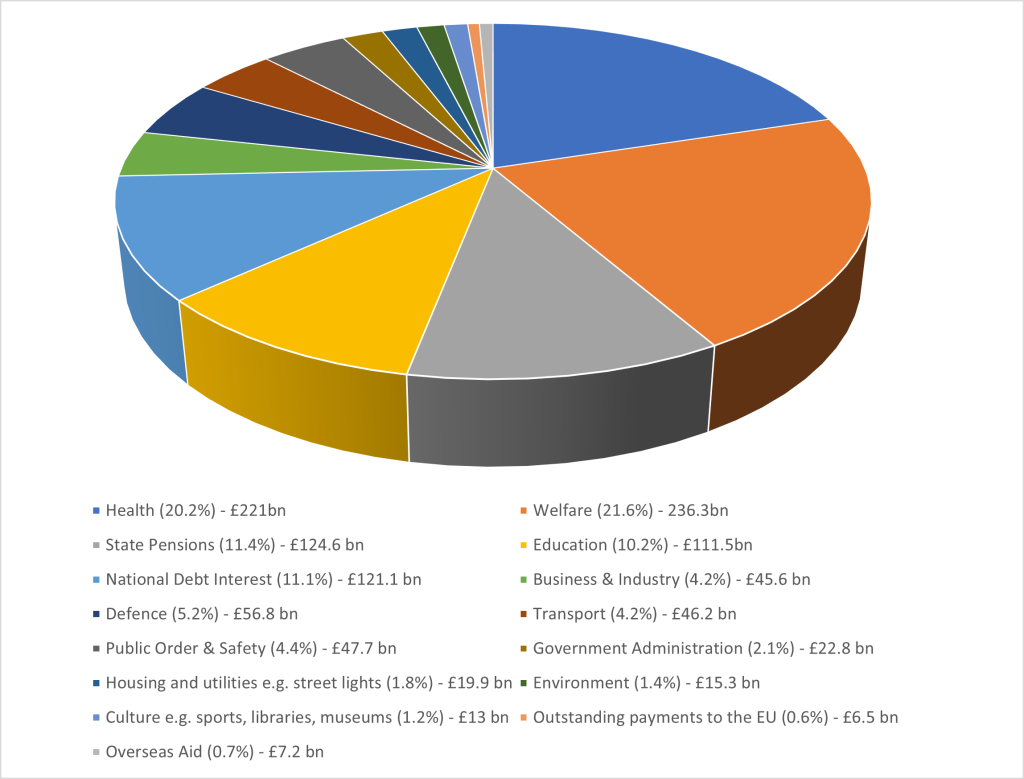
Source: PESA Public Expenditure Data for 2023-24
The four top categories have changed since 2021/22, with National Debt Interest joining Health, Welfare and State Pensions. The percentage of Income Tax and NI receipts spent across the top four areas in total has remained stable, around 65%.
- National Debt Interest has increased from £72.8bn to £121.1bn, 66%
- Welfare spend is now higher than Health.
- The UK contribution to the EU is static at £6.5 billion. With Overseas Aid spend increasing from £5.5 billion in 2021/22 to £7.2 billion in these latest figures.
- There is only one category where actual spend has fallen since 2021/2022; and that is Business and Industry.
If you want to see the full details of spending these can be found in Public Expenditure Statistical Analyses on the GOV.UK website https://www.gov.uk/government/collections/public-expenditure-statistical-analyses-pesa
Source: GOV.UK, February 2026